
OUR BLOG
A place to read up on the concepts that are key to our approach to highly effective pedagogy.
Not All Graphic Organizers Equitably Help Students Achieve Academic Goals. Here's Why They Need to Be Rethought.
The graphic organizer has been a cornerstone of pedagogy for a long time. I think we can all remember a time when we were students in school and told to brainstorm ideas using a “mind map”, an interconnected web of bubbles and lines, or to compare two things using a Venn diagram. This pedagogical tool has been in use for decades, and for good reason. They’ve been shown time and again that they facilitate students in a variety of higher order thinking skills, including multi-lingual learners and students with IEPs.
However, not all graphic organizers are created equal. While their use in the classroom may provide a general scaffolding, not all students will be able to engage with them on the same level. For instance, let's examine the Venn Diagram, the classic way to get students to compare and contrast two things. Take a look at a typical template for this graphic organizer below:

A typical Venn diagram template
At first glance, everything seems to be ready to facilitate student engagement. There are spaces at the top for students to identify the two items they are supposed to compare. There are two places on either side for students to list differences and one in the center for similarities. And there are lines indicating where students are to write their thoughts. Everything is in its right place.
Now let's imagine passing this graphic organizer out to a modern day classroom, full of students from different cultural, ethnic, and linguistic backgrounds. Many of these students will be Multilingual Learners. And within this demographic there will be many different home cultures and first languages: Spanish, Chinese, Bengali, Haitian Creole, Urdu, French, and Vietnamese to name a few.
Then you consider that there are a host of other variables impacting a student’s ability to interact with the standard Venn diagram template. Not only do students have different cultural and linguistic backgrounds, but also different levels of literacy in those first languages. Some students may have strong literacy in their first language, while others may be weak. Given that research has demonstrated that phonological awareness in a student’s first language predicts successful literacy acquisition in their second language, the needs of students will differ.
There is also the variable introduced by Students with Interrupted Formal Education (SIFE), who may be seeing a Venn diagram for the first time in their lives. By contrast, there may be students who are well-versed in its use, having used it dozens of times before.
Inevitably, all these variables will guarantee that students achieve varying levels of success with the standard Venn Diagram graphic organizer, and in varying amounts of time. If the teacher simply hands out the graphic organizer as is and delivers some oral instructions, here are some outcomes that one can expect;
Some students will completely fill out every line of the Diagram, while others will barely write a single sentence.
Some students will believe that they have finished the graphic organizer in 5 minutes or less. Others will not even be half-way done even when class ends forty minutes later.
Some students will have compared and contrasted physical characteristics, while others will have written about abstract concepts that require more thought and analysis.
Some students will have precise, detailed, and entirely correct information on their graphic organizer. Others will have mostly incorrect information. Most will probably have a mix of correct and incorrect information.
There are a few ways that a teacher can try to remedy these problems. A common one is to have students compare their graphic organizers to each other towards the end of the class, so that students have an opportunity to check their work against their peers.
While this is a form of collaboration, it really just allows loopholes for students to bypass higher order thinking on their own and rely on others. If a student is not confident in their work, they may just copy their partner’s responses word for word, an act that requires no higher order thinking whatsoever.
So what's wrong here?
Rather than try to fix problems of unequal student outcomes after students have already completed their work, wouldn’t it be better to prevent them altogether? In order to do this, we need to understand what the Venn diagram itself is lacking.
First of all, there is no chunking in the basic Venn diagram template. Chunking is essentially breaking a task down into smaller parts. Whatever students are comparing, they will be studying something in which that information lies, whether it be a picture, a text, or video. However, if that medium is not chunked into smaller bits, it is incredibly easy for a student to become overwhelmed, which raises their stress level, which in turn decreases their ability to successfully engage in the task at hand.
Second, there are no visual reminders of what students are supposed to look for in their comparison. Studies have shown that the use of visual aids can help students to absorb the content and become more interactive with their peers because there is far less fear of giving wrong answers. If visual aides were on the page, students could refer to them for a language-free scaffold that reassures them of what they’re supposed to look for.
Third, there are no clear expectations for the quality of work that the teacher is expecting of students. Should students write full sentences or just words and phrases? Should students get 3 differences and 3 similarities, or is the number of details not important? Should students look for superficial differences and similarities, like physical descriptions, or look for more abstract ones related to a theme? It’s not clear, and this lack of clarity is one of the reasons why students will produce a range of work quality.
The fourth problem is related to the third. There are no clear directions. When students find themselves confused, they cannot seek an answer themselves. They will have to rely entirely on the teacher for clarification. This may not seem like a problem for, after all, that is one of the roles of a teacher. But when you consider all the clarifying questions that may arise in a class of 30 students, it is likely that the teacher will be overwhelmed. Another issue with the lack of direction on the page is that not all students have the level of confidence to approach the teacher in the first place. A shy or insecure student may feel bad that they need additional support, and just say nothing at all.
A fifth issue is the lack of writing frames. Given that students will be approaching this task with a huge variety of linguistic backgrounds and abilities, many will need support in how to express their understanding. A student may have identified a difference between, say, insects and spiders, but may not have the knowledge of the English language needed to communicate that on the page. The result will be that the student either writes nothing or writes something that the teacher has trouble understanding, both of which are inaccurate representations of what the student actually knows.
All of these issues combine to create some formidable obstacles for Multi-lingual Learners in mastering the content and skill objective. If they aren’t resolved on the page of the graphic organizer, the teacher will almost certainly encounter a host of issues in the classroom.
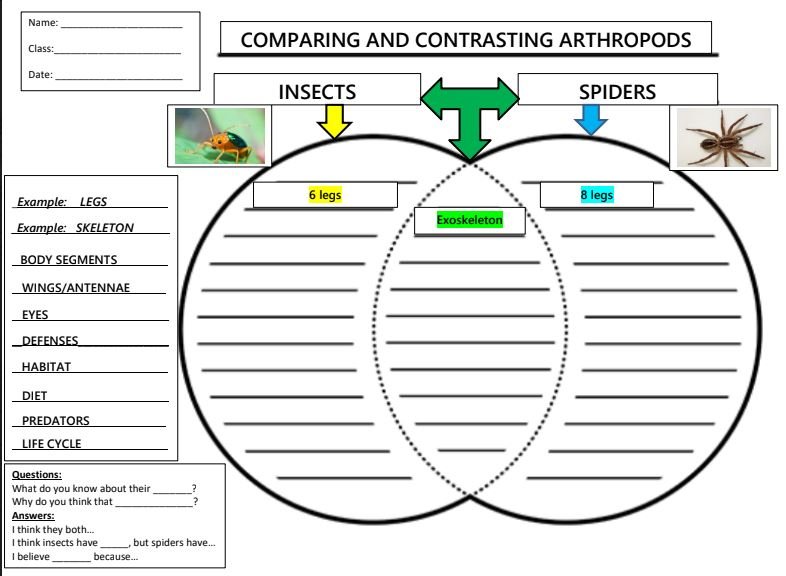
So what does a Venn Diagram that has addressed these issues look like? Take a look at a modified version below:
In this Venn Diagram, you can see these five issues have been resolved.
First, the Venn Diagram is appropriately labeled and chunked into sections. In addition, categories of comparison have been provided so that students can focus their thinking on one thing at a time.
Second, there are visual aids that remind students not only of what they are comparing, but also a color coding system to indicate what qualifies as a difference and as a similarity (blue and yellow indicate differences while their combination, green, indicates a similarity).
Third, the expectation of the teacher is clearly demonstrated by the use of examples for each of the categories.
Fourth, the directions are on the page, not only denoted by the label of the Venn Diagram, Comparing Insects and Spiders, but also by the categories of comparison on the left hand side, which indicate how that comparison is to take place.
Lastly, there are language frames which allow Multilingual Learners to structure their written work and their feedback to the partners. This fosters collaboration, allowing a more equitable way for students to check their work against that of their peers and resolve misconceptions.
So, now compare the first Venn Diagram with the second. If you were a Multilingual Learner, which one would you rather receive from your teacher?
To sum up, the criteria of chunking, visual aids, clear expectations, clear directions, and language frames are absolutely essential in producing graphic organizers that create a more equitable classroom in which Multilingual Learners can thrive. Modifying your own graphic organizers to make sure they meet these criteria is a sure way to boost student achievement.
How to Create Amazing Graphic Organizers in YOUR Classroom
The Venn Diagram is just one of many types of graphic organizers that students need to navigate in the classroom. Flowcharts, mind maps, timelines, storyboards, cause/effect chains, KWLs, concept maps, and many others abound.
Do you want to learn more about how to construct these graphic organizers in a way that ensures the success of your Multilingual Learners? Check out our free resource on the Criteria for Effective Graphic Organizers or enroll in the specialized workshop that we offer on this important topic.